Basic Matplotlib Concepts
Matplotlib is a popular Python library used to create beautiful visualizations. It helps to provide a quick summary of data, and is often used in data science when performing an exploratory data analysis.
Getting Started
If you don’t have Matplotlib already, you can install it with a quick pip install matplotlib and then import it into our program. Pyplot is Matplotlib’s plotting framework and it is common to simplify the name to plt.
from matplotlib import pyplot as plt
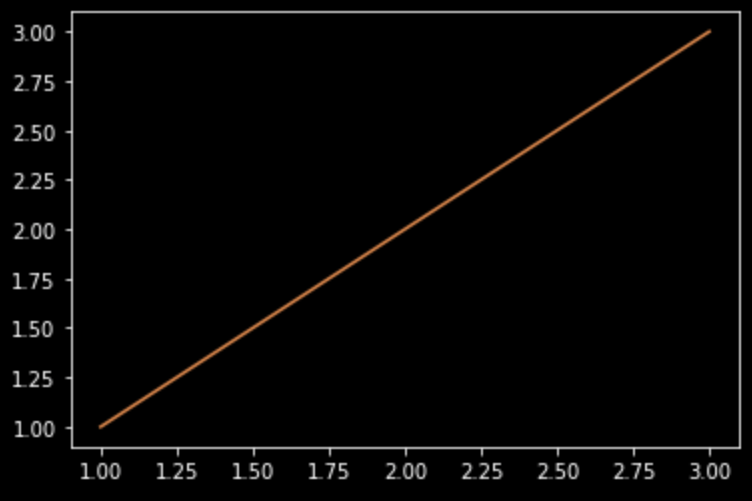
Let’s start with a simple line plot. We only need a list of x values and a list of y values to pass to the plot function on the plt module.
x = [1, 2, 3]
y = [1, 2, 3]
plt.plot(x, y)
plt.show()
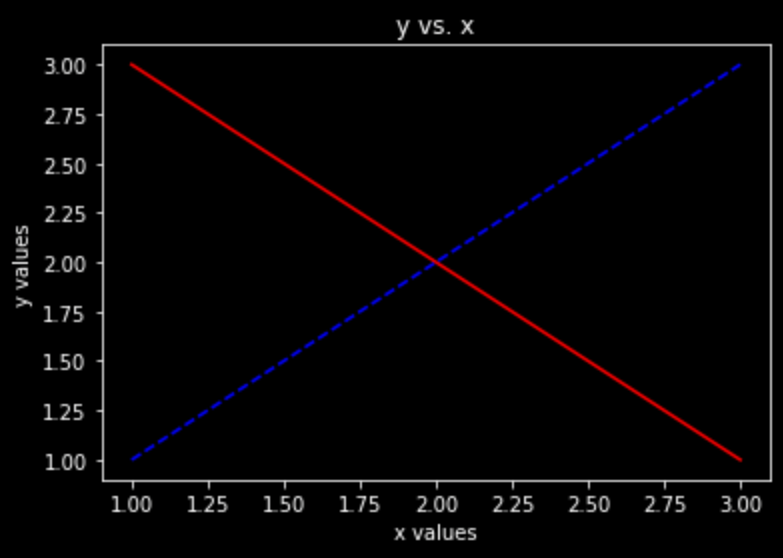
The plt module also provides methods for adding a title and axes labels.
plt.xlabel('x values')
plt.ylabel('y values')
plt.title('y vs. x')
Additional parameters of the plot function (such as color, linestyle, and label) can also be added to enhance our plot. A full list of parameters and styles can be found in the documentation. We can also plot multiple lines before calling plt.show().
plt.plot(x, y, color='blue', linestyle='dashed', label='line 1')
y2 = [3, 2, 1]
plt.plot(x, y2, color='red', linestyle='solid', label='line 2')
Besides the basic line plots, the plt module also has specific methods for creating bar charts, pie charts, scatter plots, and histograms. Each type of plot also comes with certain parameters that you can find in the pyplot documentation.
plt.bar(<parameters>)
plt.pie(<parameters>)
plt.scatter(<parameters>)
plt.hist(<parameters>)
The plt module also comes with a list of styles and you can experiment with them to find one you like. You can check out all the available styles with the command below.
plt.style.available
['Solarize_Light2', '_classic_test_patch', 'bmh', 'classic',
'dark_background', 'fast', 'fivethirtyeight' 'ggplot', 'grayscale',
'seaborn', 'seaborn-bright', 'seaborn-colorblind', 'seaborn-dark',
'seaborn-dark-palette', 'seaborn-darkgrid', 'seaborn-deep',
'seaborn-muted', 'seaborn-notebook', 'seaborn-paper', 'seaborn-pastel',
'seaborn-poster', 'seaborn-talk', 'seaborn-ticks', 'seaborn-white',
'seaborn-whitegrid', 'tableau-colorblind10']
To save an image to your local machine, you can simply run the savefig method.
plt.savefig('myfig.png')
If you want to produce a multiple plots at a time, you will need to take the object oriented approach to Matplotlib, which is discussed here.

