Matplotlib - An Object Oriented Approach
In my previous Matplotlib article, we used the pyplot object that we imported from the Matplotlib module. Notice that we did not have to create an instance of the object to use its methods.
Figures and Axes
This is where figures and axes come in. A figure in Matplotlib refers to the window that contains our plots. The plots themselves are called axes. To generate multiple plots in a single figure, we can call subplots() to instantiate figures and axes objects.
fig, ax = plt.subplots()
We now use our ax object to create plots instead of plt. Note below that when setting the x, y labels and the title, we need to prefix our original methods with set_.
ax.plot(x, y)
ax.set_xlabel('x values')
ax.set_ylabel('y values')
ax.set_title('y vs. x')
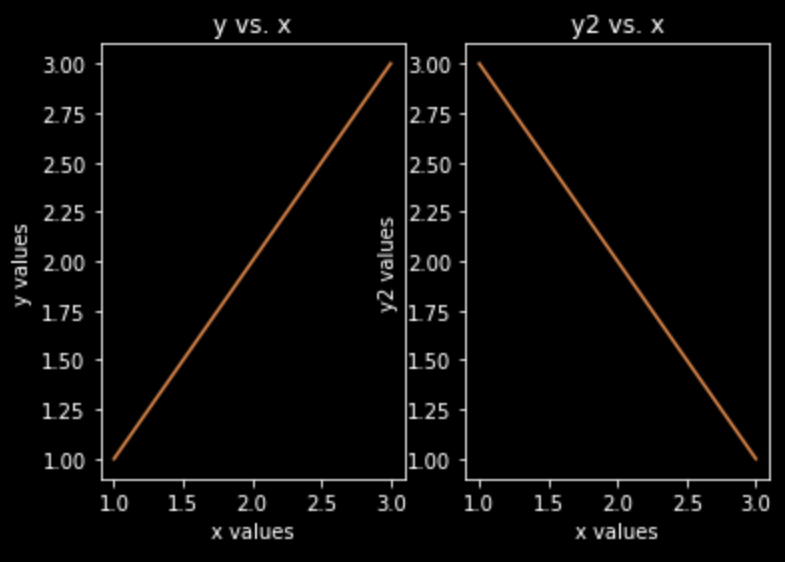
By default we would only have a 1 by 1 AxesSubplot object since we called plt.subplots() without any parameters. If we wanted two plots side by side, we can call plt.subplots(1, 2). This stores one list of two AxesSubplot objects into our ax variable (i.e. 1 row of 2 plots). If we wanted to store the plots individually instead of a list, we could instead initiate our variables using unpacking.
fig, (ax1, ax2) = plt.subplots(1, 2)
We could also separate out the two by creating two figure objects instead of two axes objects.
fig1, ax1 = plt.subplot()
fig2, ax2 = plt.subplot()
Another approach to plotting multiple plots onto a figure is to first initialize a figure object and then add axes onto the figure using the add_subplot() method. It takes 3 numbers as parameters - number of rows, number of columns, and the plot number. For example, ax1 = add_subplot(1, 2, 1) would allocate 1 row of 2 plots in our figure, and set ax1 to represent the first of two plots.
fig = plt.figure()              # initialize figure object
ax1 = fig.add_subplot(1, 2, 1)  # initalize left plot
ax2 = fig.add_subplot(1, 2, 2)  # initialize right plot
The parameters also do not need to be separated by commas, but I find it clearer this way. Calling fig.add_subplot(1, 2, 1) is exactly the same as calling fig.add_subplot(121).
Summary
Using the object oriented approach to Matplotlib allows for figures with multiple plots. This can be useful when you want to compare plots side by side or display a group of related plots. In the machine learning and data science pipeline, data visualization is a very important tool when analyzing the data you have.
